This is an article I wrote for the CMU Sports Analytics Club in 2020. I’ve reuploaded and reformatted it here. The stats are outdated and Bell cooled down significantly in the second half of the 2019 season, but there was a lot of research put into this article and I’m quite proud of it. I may post a update to this article where I look at what I may have overlooked/gotten wrong in this article along with what to expect from Bell going forward.
Despite Steelers running back Le’Veon Bell signing with the New York Jets in March 2019, there’s a new Bell in town: the Pittsburgh Pirates’ first baseman Josh Bell.
NOTE: All statistics in this article are as of June 14th [of 2019].
Understanding the Metrics
In this article, to quantify certain aspects of offensive performance, we will use some non-traditional metrics. Below is a glossary of each metric used, along with a quick summary.
Weighted On-Base Average (wOBA) – A rate statistic that attempts to credit a batter for the value of each outcome rather than treating some equally. It is on the same scale as On-Base Percentage (OBP) and is a better representation of offensive value than batting average, RBI, or OPS.
Weighted Runs Created Plus (wRC+) – A rate statistic that attempts to credit a batter for the value of each outcome rather than treating some equally. It takes into consideration everything wOBA considers, but also incorporates park, league, and era adjustments. It is scaled so 100 is average, and each point above or below 100 is equivalent to one percentage point better or worse than league average.
The above definitions were paraphrased from the FanGraphs Library.
Expected Weighted On-Base Average (xwOBA) – A metric created by Statcast, a tool used by MLB. It is an estimate of wOBA, based primarily on exit velocity (how hard the ball is hit) and launch angle (the vertical angle of the ball off the bat). Since the defense isn’t taken into account, it is more indicative of a player’s skill than regular wOBA.
The above definition was paraphrased from the MLB Statcast glossary.
Bell’s Start to the Season
Currently in his fourth season in the MLB, all with the Pirates, Bell has blossomed into one of the most feared sluggers in the National League and in the entire MLB this season. His 19 home runs are currently 8th in the Majors, and include these two mammoth home runs:
on May 8th: https://gfycat.com/meatyillegalhog
and on May 22th: https://gfycat.com/offbeatparallelhorseshoebat
Per @MLBStats, prior to this season, only three home runs have ever been hit out of PNC Park and into the Allegheny River on the fly [1]. Josh Bell did it twice in the same month. Furthermore, he has home runs of 474 and 472 feet this season, both among the ten longest in the MLB this season [2]. He is the only batter to have more than one on that list.
But beyond his prodigious power, Bell has seen improvements in nearly all aspects of his hitting. Over two full seasons (2017 and 2018) Bell put up fairly pedestrian numbers. In fact, his wOBA and wRC+ were nearly the league average for first basemen in both seasons.
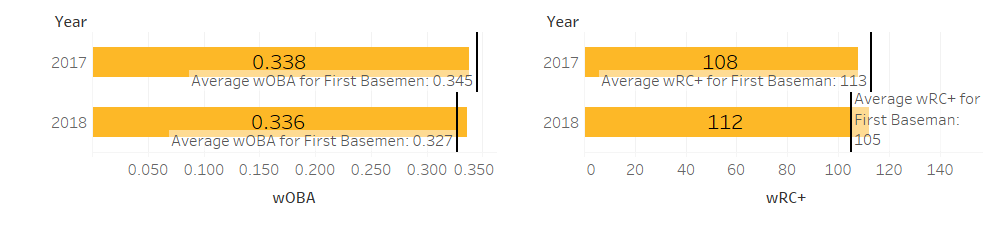
This season, things have changed. As of June 14th, Bell has a wOBA of .420 and a wRC+ of 164, both 6th in the Majors, elevating him to the level of the game’s brightest stars, such as Mike Trout and Christian Yelich.
Going further, the data from the MLB’s Statcast technology, accessed using the MLB’s Baseball Savant website, also shows significant jumps from years prior. His average Exit Velocity of 93.8, xwOBA of .399, and Hard Hit % of 51.0% all rank within the top 5% of the league. What this means is that he is hitting the ball harder, more often. The below line graph shows upward trends in both Exit Velocity and Hard Hit%.
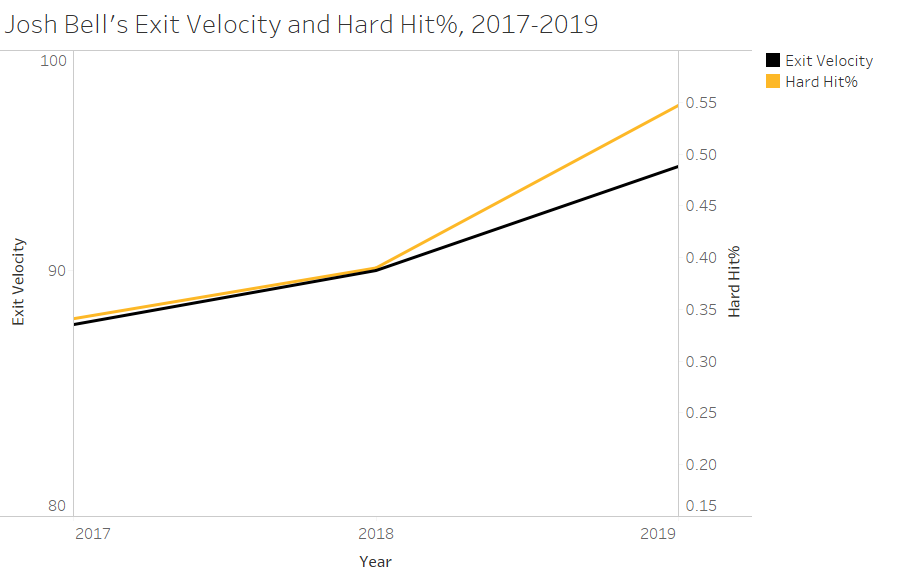
That seems to explain a lot, because intuitively, it seems like hitting the ball harder makes it less likely for the fielders to make a play and therefore more likely to get better results.
However, it would be ill-advised to attribute Bell’s resurgence exclusively to hitting the ball harder. In an article for FanGraphs, Craig Edwards showed that the correlation of exit velocity with wOBA has an r-squared value of 0.38, which is lower than many traditional statistics, such as slugging percentage, on-base percentage, and batting average [3]. This leads us to the question: How can we explain Josh Bell’s amazing start to the 2019 MLB Season?
Earlier this year, Ben Clemens wrote an article for FanGraphs to explain Bell’s sudden power surge, concluding that a simplification in his batting mechanics allowed him to start making better contact and hitting the ball harder [4]. Bell is an interesting player because his improvement hasn’t come in the “traditional” way we see a lot of batters improve – through better plate discipline and hitting balls into the air.
After players enter the league, they often see their strikeout and walk rates improve over their first few seasons. Eno Sarris found that batters usually increase their walk rate and decrease their strikeout rate over their first few years in the MLB, with both peaking around ages 26-29 [5]. Josh Bell is 26 years old, yet his walk rate of 10.4% is a career low and strikeout rate of 20.8% is a career high. He is swinging at more pitches outside the strike zone, and is making contact on less pitches in the strike zone. Bell’s improvement seems to be coming in spite of poorer plate discipline, not as a result of better plate discipline.
Similarly, we cannot point to launch angle as the reason. In recent years, the MLB has been undergoing a “fly ball revolution” – research has shown balls hit in the air are generally more valuable than ground balls, and so teams have begun encouraging their players to elevate the ball, often yielding favorable results. At the core of this methodology is a metric called launch angle, which measures the average vertical angle a ball makes with the bat after it is hit. We can look at Bell’s launch angle by season to see if it has increased this season, but again, no luck. His average launch angle of 9.4 degrees this season is nearly identical to his 2018 mark of 9.2 degrees.
So what’s his secret?
He’s learned to hit the breaking ball.
(No) Trouble with the Curve
This season, Bell’s xwOBA – 0.456 - on breaking balls has been phenomenal, ranking fourth in the league, and a whopping 202 percentage points better than in his 2018 campaign. To see how this improvement compared to other improvements from last season to this season, I created scatterplots for each pitch category (fastball, breaking ball, off-speed) and plotted the difference in xwOBA from last season to this season against 2019 xwOBA (as of June 7th) for each player. Cutoffs were set at 300 pitches seen for the 2018 season and 100 pitches seen for the 2019 season. To get this data, I used Statcast Search to find all qualified batters for each pitch type and for each Hover over a specific point to see more info.
As suspected, Bell is very far towards the right on the chart. Surprisingly, Bell doesn’t have the largest improvement on breaking balls – he is second to Cody Bellinger, who appears to be on track for an all-time great season. But one might argue that Bell’s improvement has been more unexpected, especially taking into account prior performance.
At the risk of looking too far into the data, Bell has made the largest strides on hitting breaking balls when ahead or even in the count. On 39 batted-ball events this season, Bell has an expected wOBA of 0.562, an increase of almost 250 percentage points from his 2018 mark of 0.327.
It’s tough to say what exactly Bell has changed. One possible explanation is the simplification in his batting mechanics that Clemens mentioned is particularly helpful for breaking pitches, or that he spent a lot of time in the batting cages hitting curves, or that he changed his approach towards hitting breaking balls to doing damage against them rather than trying to wait for fastballs.
One important thing to keep in mind when looking at metrics is how fast they converge towards a player’s true level. For instance, any random player could have a batting average of .600 after two weeks of games, but that wouldn’t indicate that that player would be able to sustain that average over the course of a season. In fact, FanGraph’s research has found that batting average doesn’t stabilize until after about 910 at-bats, the equivalent of almost two whole seasons [6].
So, what is the threshold for xwOBA? Is this impressive improvement just a hot streak? Unfortunately, I wasn’t able to find research on the sample size required, but Russell Carleton has done analysis on exit velocity, which we addressed earlier, and found that 40 balls in play “represent a good estimate of what a player’s actual “talent” for exit velocity” is [7]. And Bell’s exit velocity on breaking balls mirrors his expected performance, as his exit velocity increased by more than 8 miles per hour from last year.
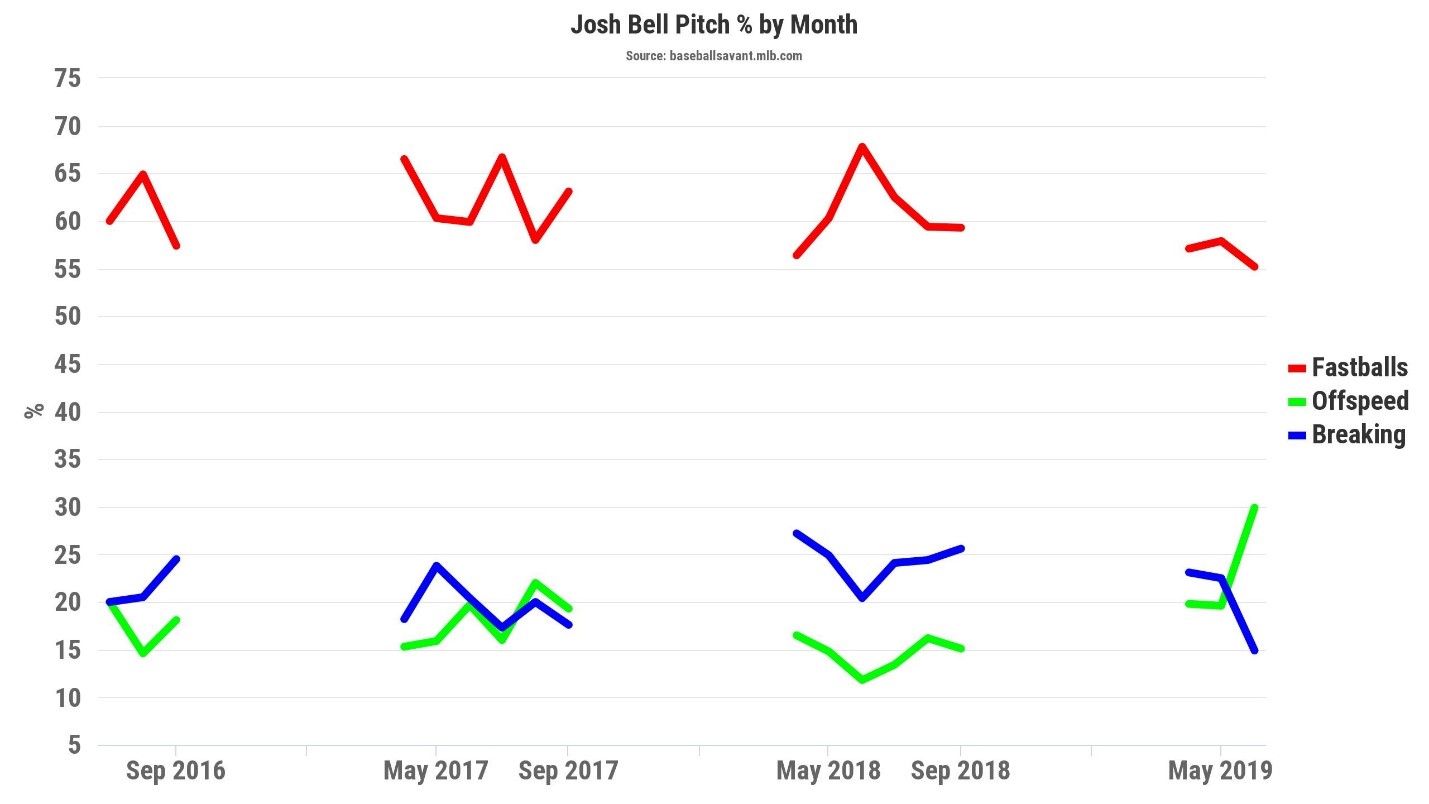
Yet, baseball is always a cat and mouse game, and I’m sure MLB analytics departments picked up on this a lot earlier than I did, with their pitchers finding out soon after. Look no further than the above chart, which shows the percentage of each pitch Bell saw by month. The percentage of breaking pitches Bell has seen in June has drastically fallen, down from 22.5% of the time in May to 14.9% of the time in June, which is actually the lowest of any individual month. Even that seems too high a percentage though. He, impossibly, seems to be getting even better against them, as his 0.579 xwOBA on breaking balls this month indicates.
While we can’t say anything conclusive just a few months into the season, the data does suggest that Bell is blossoming into a hitting machine. His performance improvement on breaking balls is especially notable, and it certainly seems possible for him to keep it up over the rest of the season.
Data came from the MLB’s Baseball Savant and FanGraphs. Figures were created in Tableau.
Sources
- [1] https://twitter.com/MLBStats/status/1131348107768356864
- [2] http://m.mlb.com/statcast/leaderboard#hr-distance
- [3] https://blogs.fangraphs.com/exit-velocity-part-i-on-the-import-of-exit-velocity-for-hitters/
- [4] https://blogs.fangraphs.com/josh-bell-now-with-power/
- [5] https://blogs.fangraphs.com/hitters-age-like-wine-power-like-cheese/
- [6] https://library.fangraphs.com/principles/sample-size/
- [7] https://www.baseballprospectus.com/news/article/28956/baseball-therapy-the-one-about-exit-velocity/